Working with Grids - Part II
In part I of this article http://howto.oz-apps.com/2012/11/games-with-grids-tilemaps.html, we saw how a board can be set up with grids where each square has a tile to represent it. In this second part of the article, we shall look at how we can scroll the tile maps to display a larger map than one that can fit the screen.
While it seems like a difficult task on scrolling larger images or tile maps, it can in fact work out to be quite easy to implement. To see how we would do that, let us have a look at a simple example.
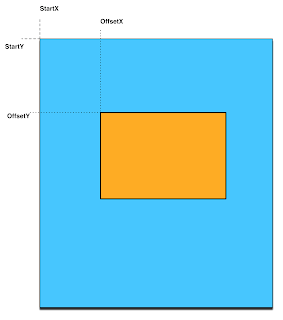
We can see that the image is the larger blue area and the display window is the orange area. The startX and the startY co-ordinates are the start of the image and the offsetX and offsetY where the display window is. You will notice logically that as we slide the display window (orange) towards the right, the offsetX increases where as moving it towards the left will reduce this offsetX. In a similar manner, as the window moves upwards, the offsetY decreases and as it moves downwards, offsetY increases.
When we move the display window to the extreme bottom right edge, we would see nothing because the offsetX and offsetY would sit at the extreme edge of the image. So to ensure that we never end up with moving the display window beyond the image, the maximum value (maxX, maxY) that offsetX and offsetY should never exceed imageWidth - windowWidth and imageHeight - windowHeight.

Now that we understand this bit, we can use this knowledge with our tilemaps. In relation to our grid maps, we can define that we would have our display window to be of
so we could use something like
As we alter our offsetX and offsetY, and call this function drawDisplay, we can see the updated tilemap. increasing the offsetX and calling the drawDisplay function would provide an illusion of scrolling left. as we discussed a while earlier, we should never let the value of offsetX go beyond maxX so that we do not get blank areas.
this would return the grid row column that was tapped and the following code would return the x, y position of the tile for row, col
Now when we want to scroll, we can simply alter the offsetX and offsetY parameters to scroll and update the tilemap.
That's how easy it is to manage scrolling and tilemaps. In the next part, we shall look at displaying the tilemap (and specific calls for various frameworks) Your feedback would be most valuable and welcome.
While it seems like a difficult task on scrolling larger images or tile maps, it can in fact work out to be quite easy to implement. To see how we would do that, let us have a look at a simple example.

We can see that the image is the larger blue area and the display window is the orange area. The startX and the startY co-ordinates are the start of the image and the offsetX and offsetY where the display window is. You will notice logically that as we slide the display window (orange) towards the right, the offsetX increases where as moving it towards the left will reduce this offsetX. In a similar manner, as the window moves upwards, the offsetY decreases and as it moves downwards, offsetY increases.
When we move the display window to the extreme bottom right edge, we would see nothing because the offsetX and offsetY would sit at the extreme edge of the image. So to ensure that we never end up with moving the display window beyond the image, the maximum value (maxX, maxY) that offsetX and offsetY should never exceed imageWidth - windowWidth and imageHeight - windowHeight.

Now that we understand this bit, we can use this knowledge with our tilemaps. In relation to our grid maps, we can define that we would have our display window to be of
dispWidth squares wide and dispHeight squares high, where as our entire tilemap could be fullMapWidth squares wide by fullMapHeight squares high. And we can calculate our maxX and maxY as fullMapWidth - dispWidth and fullMapHeight - dispHeight. With that math out of the way, now what we need to do is simply display our tiles that start at offsetX till offsetX + dispWidth, this gives us the dispWidth number of tiles starting from offsetX.Drawing the board
To draw the board, we would use a simple loop which displayed a tile at the currrent position and then increase the position to display the next tile.so we could use something like
function drawDisplay()
 currentX = 0
 currentY = 0
 tileWidth = 64
 tileHeight = 64

 for i = offsetY, offsetY + dispHeight do
   currentX = 0
   for j = offsetX, offsetX + dispWidth do

     --DrawTile at this currentX and currentY

     currentX = currentX + tileWidth
   end

   currentY = currentY + tileHeight

 end
end
As we alter our offsetX and offsetY, and call this function drawDisplay, we can see the updated tilemap. increasing the offsetX and calling the drawDisplay function would provide an illusion of scrolling left. as we discussed a while earlier, we should never let the value of offsetX go beyond maxX so that we do not get blank areas.
Calcualting which cell was tapped
Similarly determining the square that was tapped on the device can be calculated easily from the touch point x, y as followsfunction getRowColFromXY(x, y) local theX, theY = math.floor(x/tileWidth), math.floor(y/tileHeight) local _x, _y = theX - offsetX, theY - offsetY return _x + 1, _y + 1 end
this would return the grid row column that was tapped and the following code would return the x, y position of the tile for row, col
 function getXYForTile(row, col)
  local startX, startY = col - offsetX - 1, row - offsetY - 1
  local _x, _y = startX * tileWidth, startY * tileHeight

  return _x, _y
 end
Now when we want to scroll, we can simply alter the offsetX and offsetY parameters to scroll and update the tilemap.
That's how easy it is to manage scrolling and tilemaps. In the next part, we shall look at displaying the tilemap (and specific calls for various frameworks) Your feedback would be most valuable and welcome.
Comments
Post a Comment